Herd Immunity
In this short post, I’m going to discuss the importance of herd immunity and vaccination using a simulation performed in Python to demonstrate a simple model of a random infectious disease spreading in a population, in which people move around on a square grid. The source code for the simulations can be found in a Jupyter Notebook here.
Simulation Set Up
In all the simulations, I have assumed that if you get vaccinated or recover from the disease, you have immunity for life and can not get sick again, and a person is infectious for 21 days. I have not included a death rate, so everyone recovers and becomes immune, but for most epidemics, some of those infected die rather than becoming immune.
Each time step is considered a day, and during each time step, each person can move only in the x or y directions. They randomly move up, down, right, or left 1 unit or stay in place, simulating daily movement of people. When two people land on the same spot, infection can be transmitted. In this model, if an infected person comes in contact with an uninfected, unvaccinated person, the second person will be infected. This is a model simplification since the right combination of factors, including close, prolonged contact and pathogen dose, are required for disease transmission. There is also no social distancing, quarantining, or isolation in this model; people move around in the same manner at all times.
In the following GIF, there are 500 people in an area with 400 spots for people (20 by 20 grid). No one has prior immunity to the pathogen, either by vaccination or prior exposure, so everyone is susceptible at the start. At the start of the outbreak, a single person is infected. Infection status is indicated by color: yellow = susceptible, red = infected, and blue = immune.
The plot below shows the results of the simulation in the GIF. The numbers of infected, susceptible, and immune people are shown over time. On day 0, the first person is infected, and the outbreak ended on day 61 once everyone had been infected and recovered. In scenarios with a lower population density, often some susceptible people remain at the end. This occurs because they may not encounter any infected individuals before all those infected recover. The index case also occurred near the center of the grid, simulating a person with a lot of contacts. If the outbreak had started near the periphery of the grid, it would have taken longer to progress because of slower transmission early on.
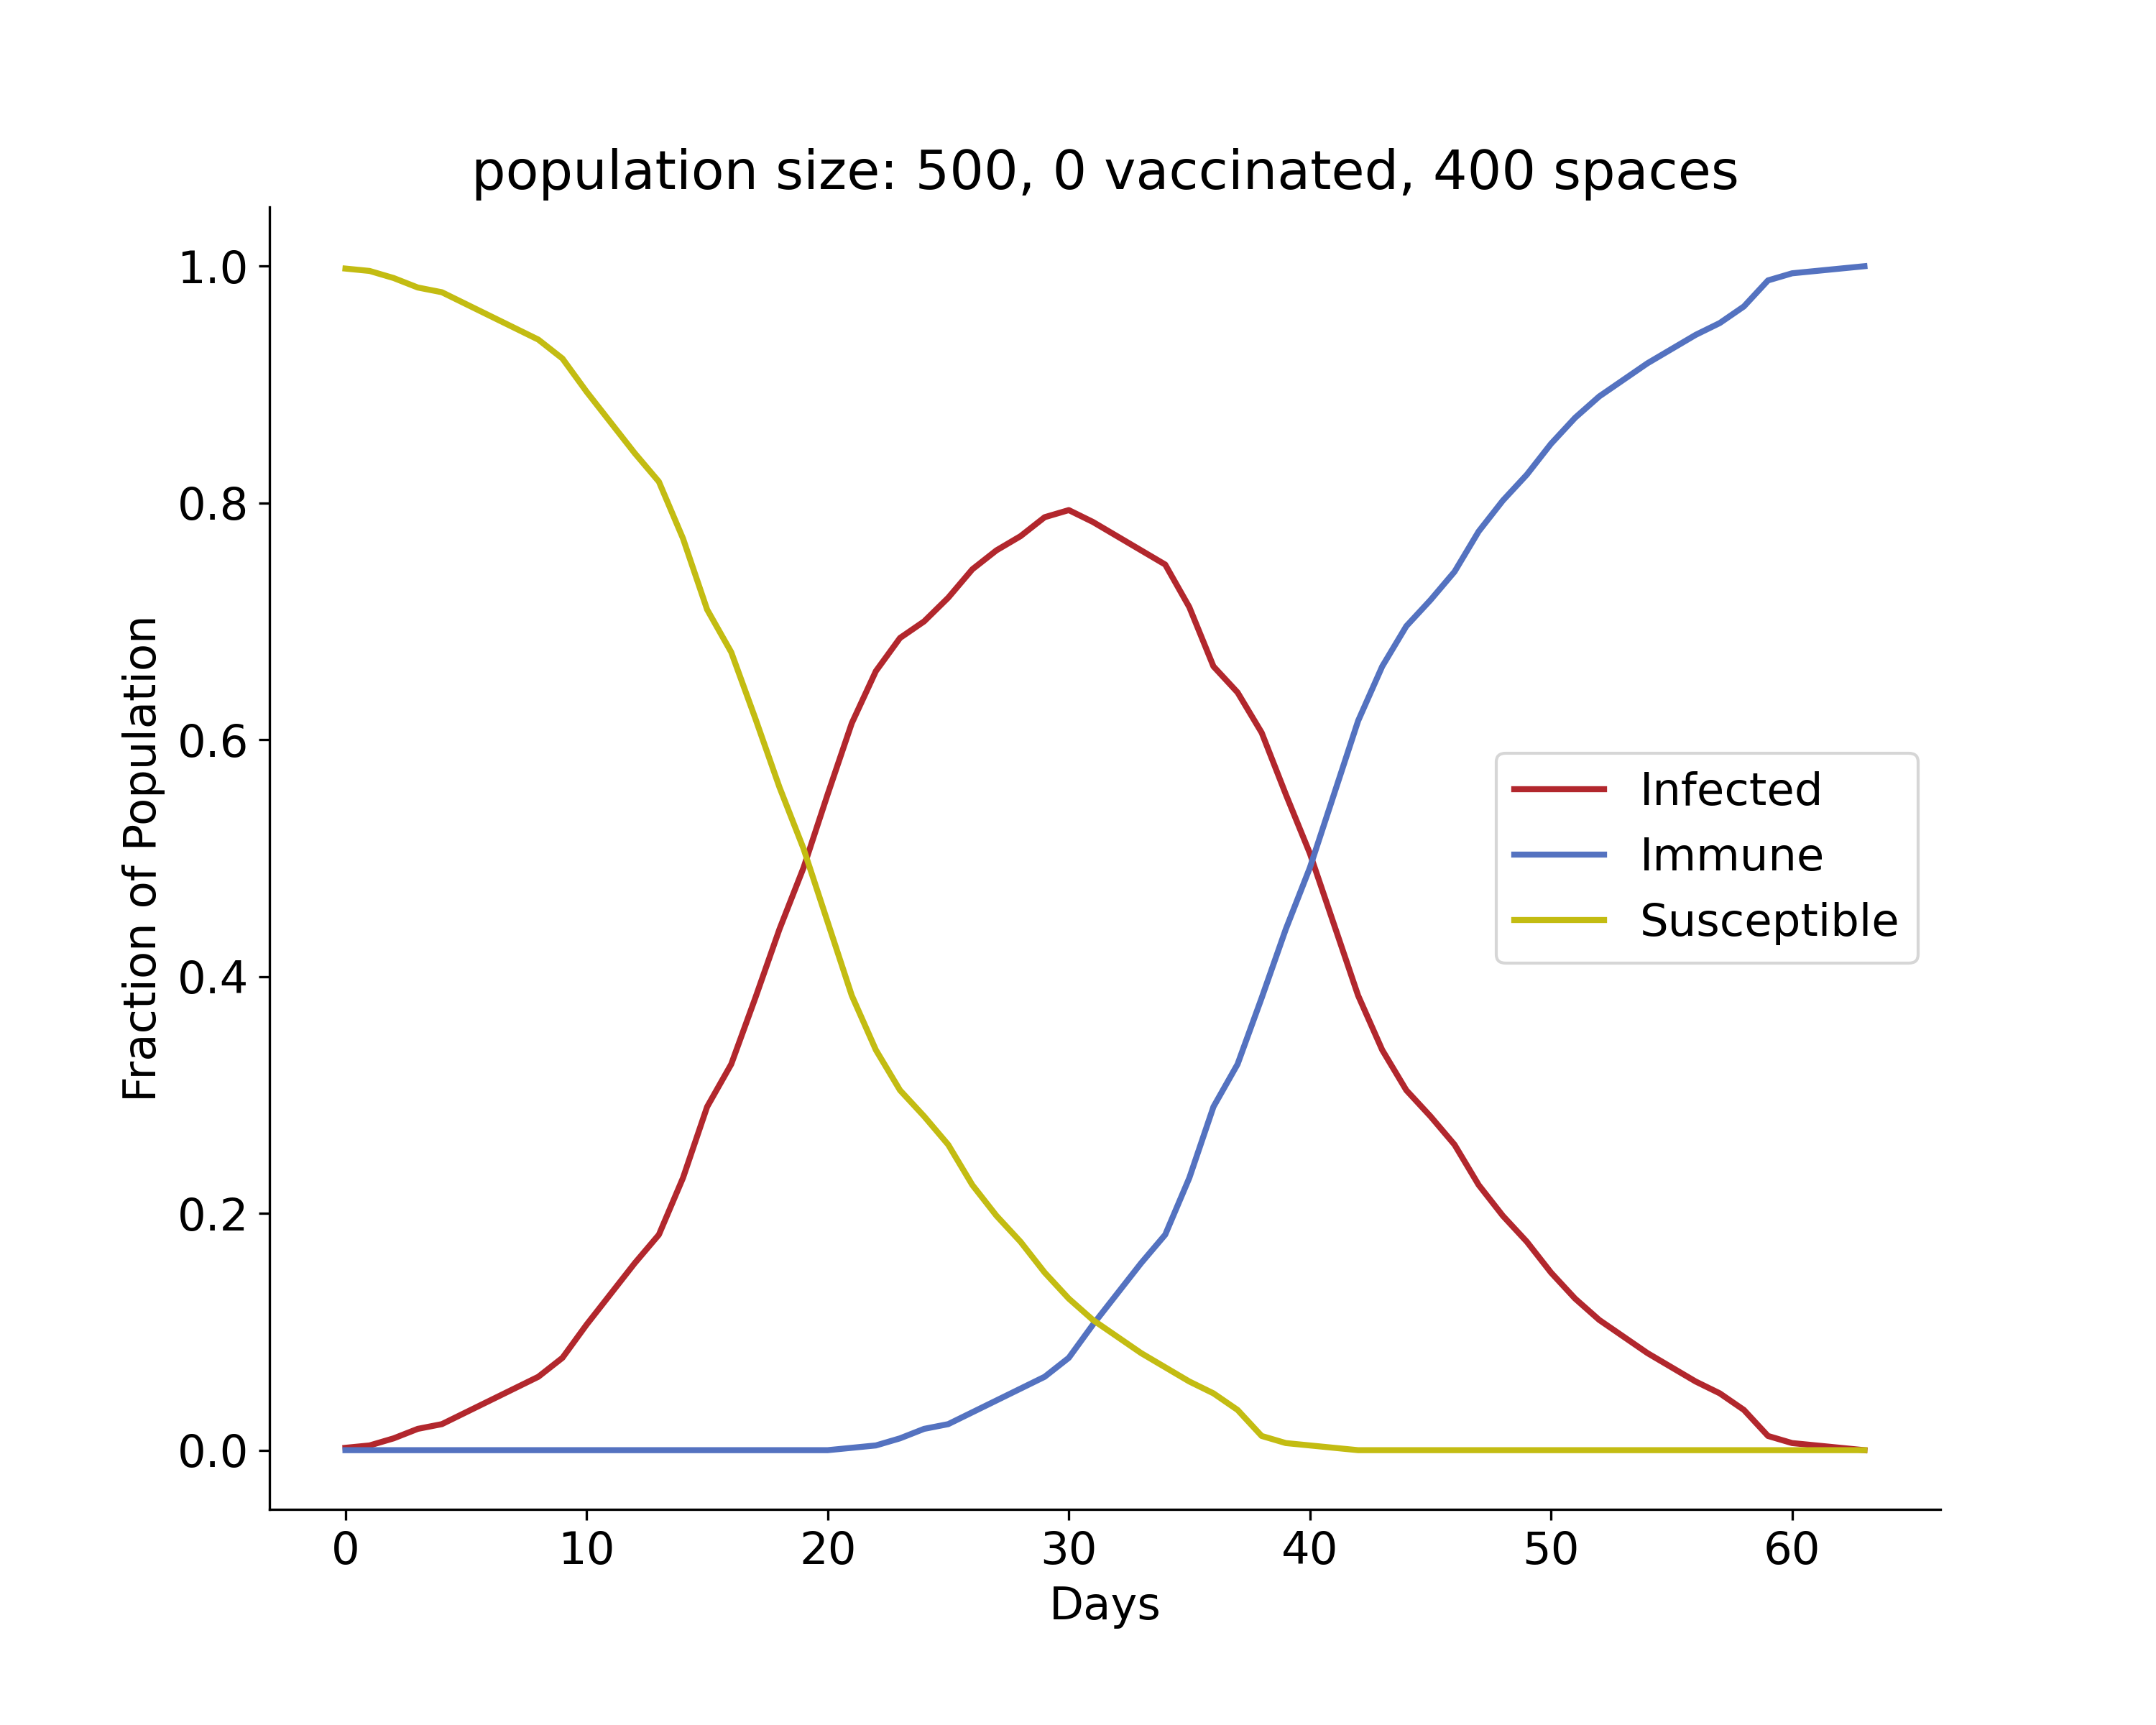
Over time, we see that there is a rise and fall in the number of infections, and at its peak, approximately 80% of the population was infected. This is very high because the index case had many close contacts, spreading the infection quickly. The number of immune individuals only becomes non-zero starting at day 21 because the index case is infectious until then, based on the model requirements.
To generate the following plots, simulations were run with 10,000 people each. Different proportions of people are vaccinated at the start, and the vaccinated move around the board without getting infected or infecting others. The numbers of infected, immune, and susceptible people are shown for different scenarios.
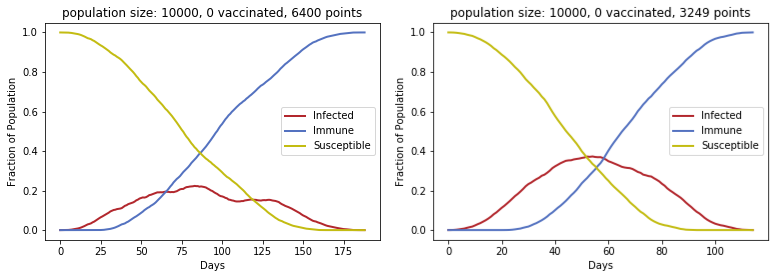
In the left figure, the maximum number of infected people at any given time is approximately 20%. The grid area for this simulation is twice that of the grids for the other 3 simulations. Thus, we see that approximately halving the area (number of points) gives a sharper curve for active infections. In both situations, all 10,000 people eventually became infected, but the peak occurs earlier and is higher with a larger population density. This demonstrates how lower density of people can be an asset in an outbreak (“flattening the curve” to avoid overwhelming hospitals and preventing people from getting critical care), but it will prolong outbreaks as well.
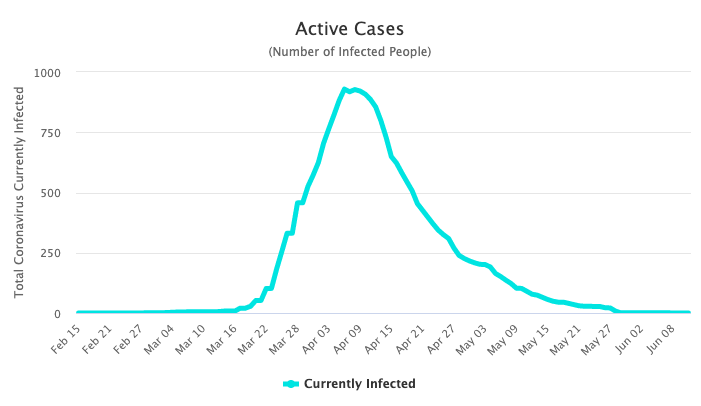
Even though this is a simple model, the number of infections over time closely resembles the infection curves for other epidemics that “burned out” in their populations. That is, they were stopped when there were no longer any active infections to continue to spread the infectious agent. For example, we see that as of June 12th, 2020, the spread of SARS-CoV-2 seems to have been controlled in New Zealand. The maximum number of active cases in New Zealand (population 5 million) at any given time was less than 1000, which is less than 0.02% of the total population. Since there are currently no active infections, we can get a full outbreak picture. 1
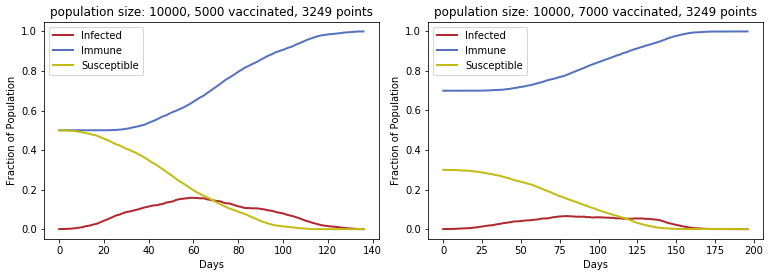
If we introduce vaccination into the populations, the infection curve becomes much flatter and wider, reflecting fewer active infections. In the two plots below, some fraction of the population (50% or 70%) is vaccinated against the pathogen at the outset, so the number of immune people at the start is high. Since fewer people can be infected, fewer people are able to transmit the infection, and consequently, fewer people will die (not shown here).
Vaccination reduces caseload and also protects those who are not vaccinated from infection. In the plot below, in which 90% of the population was vaccinated, the outbreak ended with 248 people still susceptible. The number of active cases remained very low throughout, reaching a maximum of only 74, and because of the high proportion of immune individuals even from the beginning, other members of the population were protected. This is important for people who can not be given certain vaccines. Infants less than 6 months old should not receive them, and depending on the vaccine type, it may not be suitable for immunocompromised people, such as those with HIV infection or organ transplants requiring immunosuppressive therapy.

In the above plot, the immune population is not shown because it is much higher (starting at 9000), but as the number of susceptible individuals drops, the immune population increases. Although the outbreak took much longer to end than in the other situations, from a public health perspective, fewer hospitalizations would have been required, and the general public would not need to remain in a full lockdown to prevent an explosion of cases.
Herd Immunity
This is what’s called herd immunity. In a population (or herd) of people or animals, a sufficient degree of immunity can protect those who are not immune to an infectious disease by preventing transmission of the pathogen. If the pathogen can not survive and replicate in hosts in order to be transmitted between them, it will eventually die out. This is why vaccinations must continue. In the developed world, diseases such as polio, measles, diphtheria, and tuberculosis are rarely seen, but they kill millions of children in countries where they are still endemic, or actively circulating. Vaccines drive down caseloads because infectious agents are unable to survive in a human population, so often we become complacent that there is no threat of such disease resurging.
However, this threat is very real due to the rapid movement of people and goods around the world and the increasing threat of zoonoses. Zoonotic pathogens originated in other animals (natural reservoirs) and later reached and adapted to humans. Even if such pathogens are eradicated from the human population, they can survive in animal hosts. If a vaccine for such pathogens is developed, continued vaccination, even if the disease disappears from humans, is required because future animal-to-human transmissions are likely (and probably inevitable).
Measles Vaccination
In addition, travelers from countries with higher rates of a disease such as measles can bring the virus to other countries where there is no longer endemic transmission. If herd immunity is present, then the outbreak will be contained, but if vaccination drops, cases will spread quickly. In March 2014, a measles outbreak in Ohio was seeded by Amish missionaries traveling back from the Philippines, where an outbreak had caused tens of thousands of cases 2. Due to significantly lower vaccination rates among the Amish community (14% vs. 88% in the general population at that time), measles spread quickly, eventually infecting close to 400 people 2. Another measles outbreak in 2014-2015 in Anaheim, CA was believed to be linked to overseas travelers who spread it at Disneyland, but no source was determined 3. An outbreak in 2018-2019 in New York City occurred in an Orthodox Jewish community with low vaccination rates and was seeded by travelers returning from Israel, where another measles outbreak was underway 4. Most cases in these outbreaks were unvaccinated individuals.
The measles vaccine (in the measles-mumps-rubella formulation) is very effective. Before widespread vaccination began in 1963, there were 3-4 million cases in the United States annually, while today, the number is around 1000 5. We have unfortunately been seeing more measles cases in the United States as a result of reduced vaccination coverage, with 2019 showing an alarming increase 3. Measles is very contagious, with an R0 value of around 15, which means that on average, each person with measles spreads it to 15 other people, and the virus can be spread pre-symptomatically and through air and infected surfaces. The vaccination threshold for herd immunity for measles is 90-95% due to its contagiousness. Thus, even a small drop in measles vaccination can cause widespread infection, particularly in health care facilities where measles cases are rarely seen and therefore not expected. This (and many other examples) attests to the importance of vaccination not just for individuals, but also for public health. If and when a vaccine for SARS-CoV-2 is developed, the vaccine must be made available to and taken by every person to stop its spread throughout the world.
It is also important to remember that without vaccination, the number of susceptible individuals will rise due to births and people moving into the population. Although a pathogen may make its way through most or all of the population as in the GIF and leave recovered people immune, new individuals born into the population and deaths of immune people will eventually increase the proportion of susceptible individuals. This will allow the same pathogen to spread again through the group as the percentage of immune people drops. Vaccination prevents fluctuations in the host population from facilitating future outbreaks by the same pathogen.
Leave a Comment